The world is a complex place. Recent explorations and discoveries regarding the orderly tumult of our world (Chaos and Complexity Theories) have helped us to put language to things we sensed but were unable to pin down: Non-Linearity, Butter Fly Effects, Strange Attractors, etc.
Markets are wonderfully chaotic and complex beasts. Why not!? After all, markets are where multitudes of people work and play. Therein lies the rub. The old trader's adage that "Everything you need to know is in the price" is tremendously frustrating to new players in the field. There MUST be more to it than that! Certainly! And yet, price has the final say, regardless of all the "explanations" we attempt; Almost always making monkeys of us story tellers.
Price is that momentary settlement between buyers and sellers. It never, ever stays still. It's like the breath of an invisible beast. Price tells us of the instant. Each instantaneous price, one after another, tells us a story. Is the beast asleep? Is it on a walk about? Galoping madly in a panic? Catching a breath? Nap time after a meal?
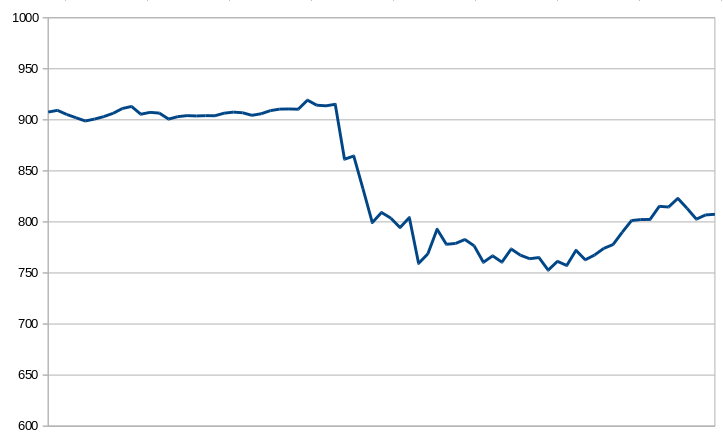
Time Series charting is a well worn tradition within the trading community. One can see obvious price trending. One can see patterns of price behaviour. Many 'systems' of interpretation have been built to tease out "signals" of advanced price movements, thereby giving the wily trader an advantage in the fray.
All well and good, yet we sensed something lacking in that Spy Glass of Time Series charting and interpretation: Rules upon patterns upon caveats and exceptions reminds one too much of medieval astronomical theories: Far too complicated, never entirely satisfying. After all we are talking about a wild thing, this market. A wild thing built from all the emotions, reason, impulses and conflicts within and among thousands of players to settle on this one instantaneous price, and then another. No small task.
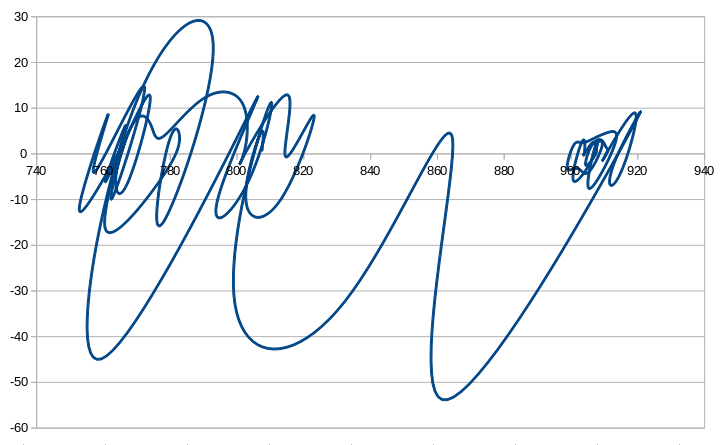
In the later 1990's we began to explore other options for watching price, specifically in the gold markets. Our first observation was that too much emphasis was placed on the time dimension. Time sequence is seen clearly without denominating a whole axis to its obvious succession. So what quality of price might we use for a second dimension in place of time? After consideration we came upon a simple, first answer: "price change from prior price" ( within Calculus that quality is called a "first order derivative" - change).
Thus our first "Swirl-O-Grams" were born to the light of day: a crazy, loopy, tangled and lively mess of a chart. The breath of the invisible beast which never rests and always changes. In this view we see nominal price on the X-axis and change of price on the Y-axis. Each momentary price (x) is matched with its change from the prior moment (y), and the curvaceous trace between these successive dots describes the flow of this wild thing, this market, which is the expression of thousands of players across the world.
Other derivatives of price can be used for 'y' data. But change over prior price is sufficiently powerful and easiest to grasp, and remains a staple for us. Here, as we watch global Bitcoin prices, we mostly use this approach to observe this new market and it's behaviours. Our written commentary seeks to find patterns of behaviour, which may give clues to the future paths of this Bitcoin Market Beast. New and bold, it races and retraces, catching the wind in its nostrils, never resting as it is truly a free market - a spring born bull calf kicking and bellowing for all it is worth, no fence to hold it back.

